Macroeconomics indicators of Norway are looking very good compared to it's neighbors!
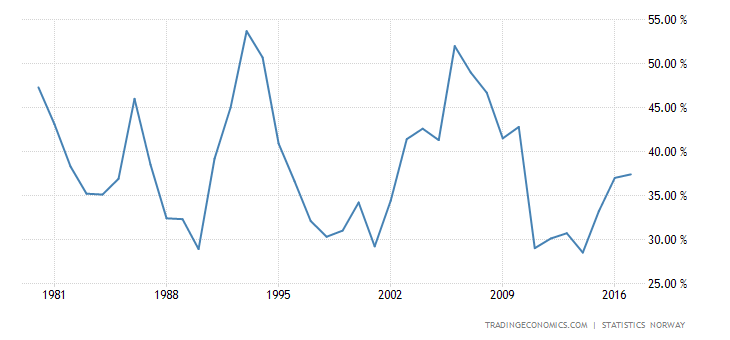
Very low debts
Norway recorded a government debt equivalent to 35.60 percent of the country's Gross Domestic Product in 2016.
 |
| https://tradingeconomics.com/norway/government-debt-to-gdp |
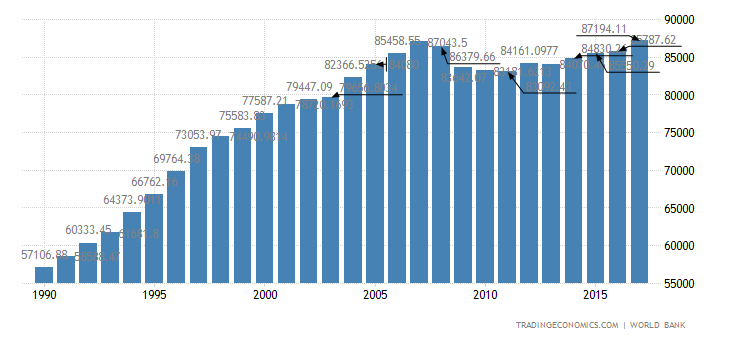
GDP per capita looks healthy
The Gross Domestic Product per capita in Norway was last recorded at 64272.16 US dollars in 2015, when adjusted by purchasing power parity (PPP). The GDP per Capita, in Norway, when adjusted by Purchasing Power Parity is equivalent to 362 percent of the world's average.
 |
| https://tradingeconomics.com/norway/gdp-per-capita-ppp |
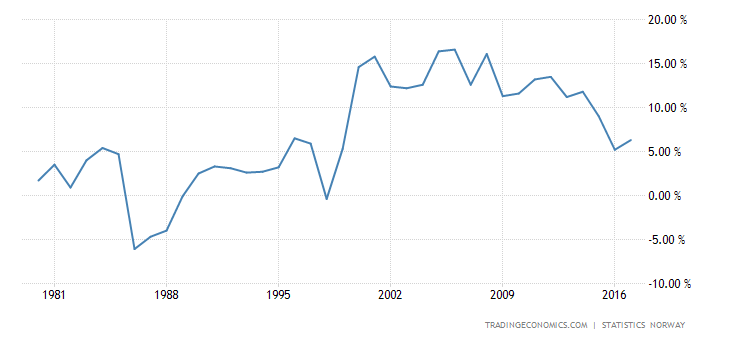
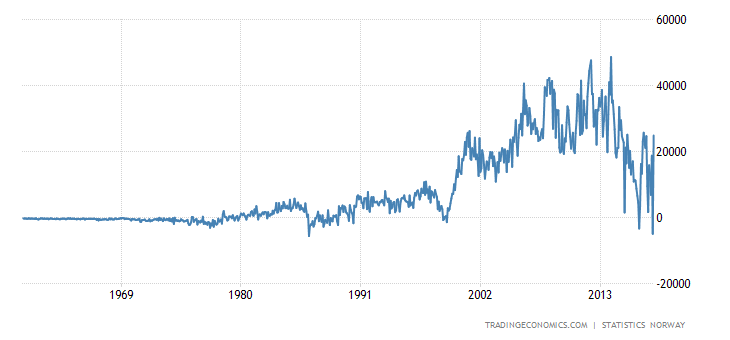
Current Account and Balance of Trade generate quiet good surplus
Norway recorded a Current Account surplus of 4.90 percent of the country's Gross Domestic Product in 2016. Current Account to GDP in Norway averaged 6.85 percent from 1980 until 2016, reaching an all time high of 16.20 percent in 2005 and a record low of -6.10 percent in 1986.
 |
| https://tradingeconomics.com/norway/current-account-to-gdp |
 |
| https://tradingeconomics.com/norway/balance-of-trade |
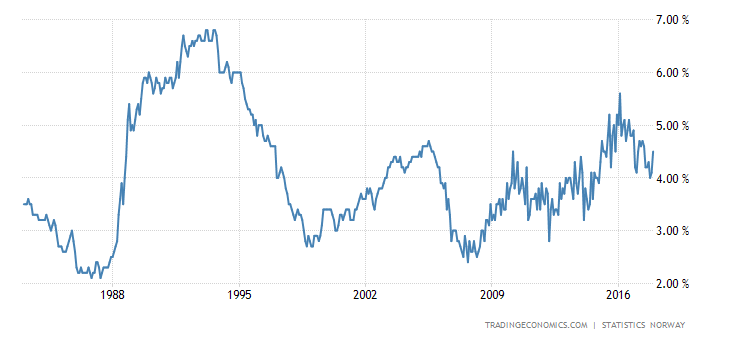
Unemployment rate is as low as US (much lower as euro-zone average with 9.2%)
Norway's seasonally adjusted unemployment rate edged up to 4.6 percent in the three months to May 2017 from 4.3 percent in the December-February period and above market expectations of 4.4 percent.
 |
| https://tradingeconomics.com/norway/unemployment-rate |
Main stock index the Oslo Børs All Share Index (OSEAX) is performing very well over the last 4 years, since other european stock indices were in trouble during the same time.
 |
| Yahoo Finance; goo.gl/CUASdx |
| http://www.indexmundi.com/norway/age_structure.html |

Keine Kommentare:
Kommentar veröffentlichen