blog.darkstar.work - a simple url encoder/decoder

 a simple url encoder/decoder
 http://blog.darkstar.work

Labels

Wirtschaft (152) Pressefreiheit (131) Österreich (123) IT (98) code (62) Staatsschulden (37) EZB (27) Pensionssystem (16)

2017-07-12

macroeconomics indicators of Poland

Macroeconomics indicators of Poland are looking quiet OK compared to southern european countries!

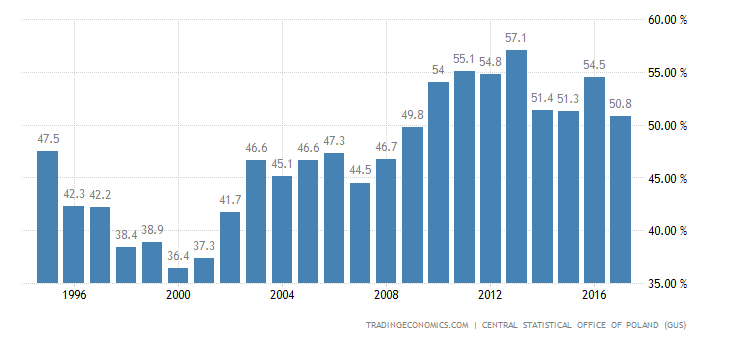
government debt under Maastricht criteria

Poland recorded a government debt equivalent to 54.40 percent of the country's Gross Domestic Product in 2016. Government Debt to GDP in Poland averaged 46.47 percent from 1995 until 2016, reaching an all time high of 55.70 percent in 2013 and a record low of 36.50 percent in 2000.
https://tradingeconomics.com/poland/government-debt-to-gdp

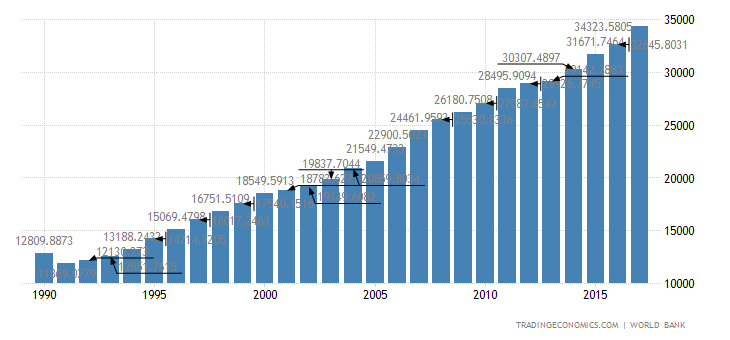
GDP per capita looks healthy

The Gross Domestic Product per capita in Poland was last recorded at 26003.01 US dollars in 2016, when adjusted by purchasing power parity (PPP). The GDP per Capita, in Poland, when adjusted by Purchasing Power Parity is equivalent to 146 percent of the world's average.
https://tradingeconomics.com/poland/gdp-per-capita-ppp

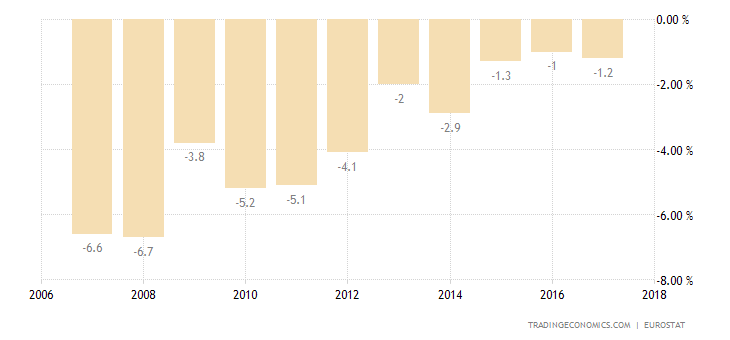
Current Account could be a little bit better, but is mostly balanced now

https://tradingeconomics.com/poland/current-account-to-gdp

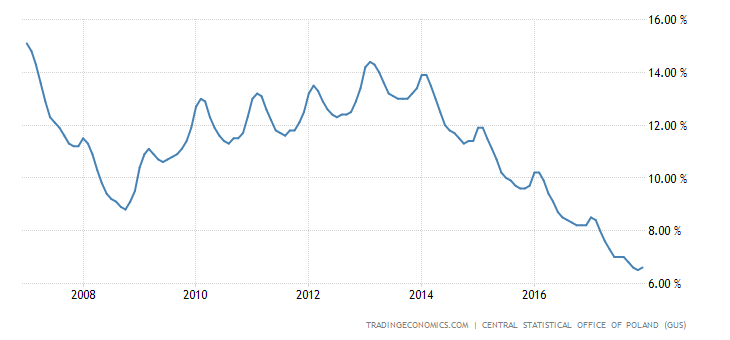
Poland succeeded to lower unemployment rate since 2008 very well

https://tradingeconomics.com/poland/unemployment-rate
Main stock index the Warsaw Stock Exchange WIG is performing very well over the last 4 years, since other european stock indices were in trouble during the same time.
Source: https://www.bloomberg.com/quote/WIG:IND

Polish zloty has approximately same value as turkish lira


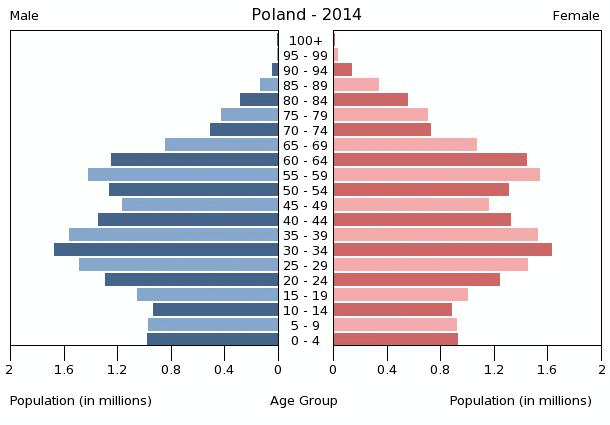
At least demographics of Poland (Population age pyramid) could be better and is not so balanced,
http://www.indexmundi.com/graphs/population-pyramids/poland-population-pyramid-2014.gif

2017-07-05

macroeconomics indicators of Norway

Macroeconomics indicators of Norway are looking very good compared to it's neighbors! 

Very low debts
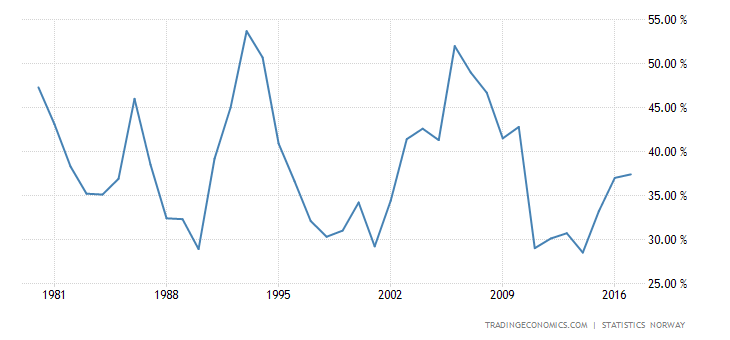
Norway recorded a government debt equivalent to 35.60 percent of the country's Gross Domestic Product in 2016.

https://tradingeconomics.com/norway/government-debt-to-gdp
GDP per capita looks healthy
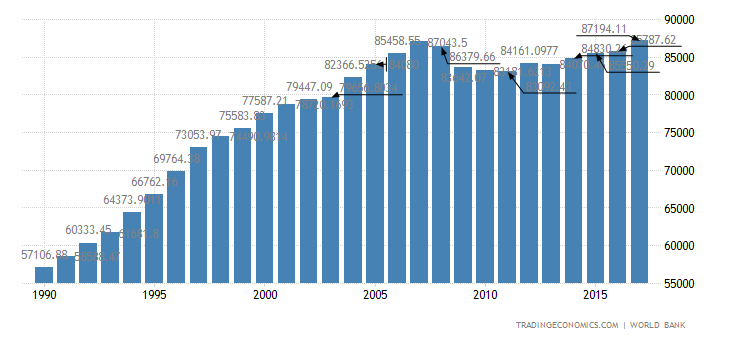
The Gross Domestic Product per capita in Norway was last recorded at 64272.16 US dollars in 2015, when adjusted by purchasing power parity (PPP). The GDP per Capita, in Norway, when adjusted by Purchasing Power Parity is equivalent to 362 percent of the world's average.
https://tradingeconomics.com/norway/gdp-per-capita-ppp
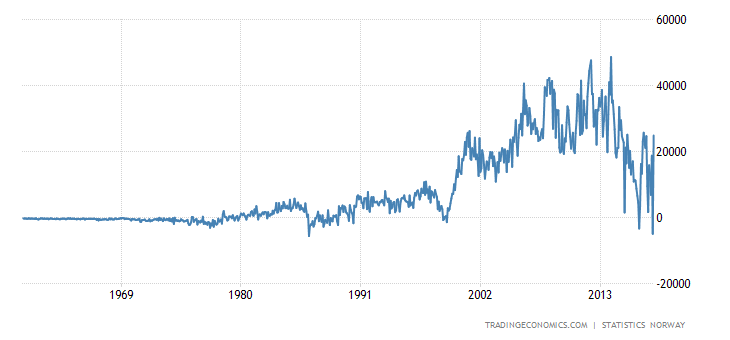
Current Account and Balance of Trade generate quiet good surplus 
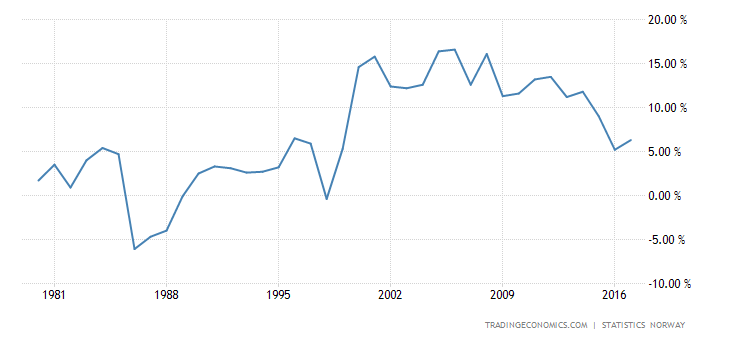
Norway recorded a Current Account surplus of 4.90 percent of the country's Gross Domestic Product in 2016. Current Account to GDP in Norway averaged 6.85 percent from 1980 until 2016, reaching an all time high of 16.20 percent in 2005 and a record low of -6.10 percent in 1986.
https://tradingeconomics.com/norway/current-account-to-gdp
https://tradingeconomics.com/norway/balance-of-trade

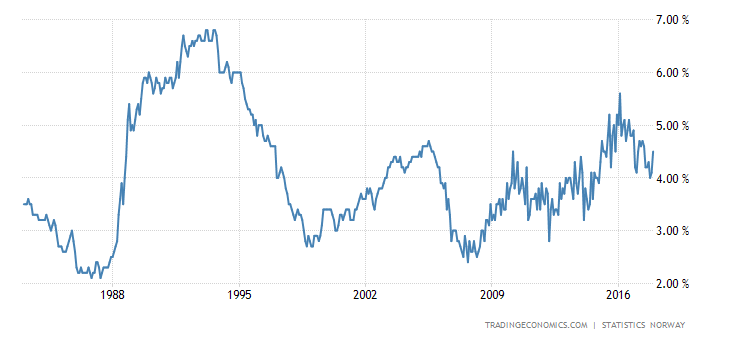
Unemployment rate is as low as US (much lower as euro-zone average with 9.2%)
Norway's seasonally adjusted unemployment rate edged up to 4.6 percent in the three months to May 2017 from 4.3 percent in the December-February period and above market expectations of 4.4 percent.
https://tradingeconomics.com/norway/unemployment-rate

Main stock index the Oslo Børs All Share Index (OSEAX) is performing very well over the last 4 years, since other european stock indices were in trouble during the same time.
 Yahoo Finance; goo.gl/CUASdx
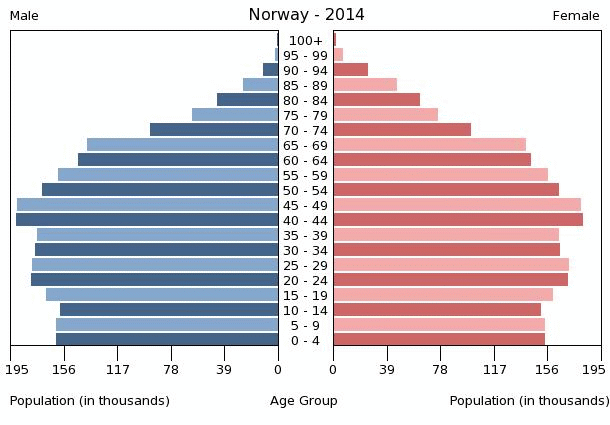
Last but not least, demographics of Norway (Population age pyramid) are looking better than many other european countries (e.g. Germany).
http://www.indexmundi.com/norway/age_structure.html

2017-07-01

Was machen die USA, Kanada und Mexiko besser als die EU?

Wenn ich mir die Arbeitslosenzahlen in den USA, Kanada und Mexiko ansehen, dann liegen die gesamt gerechnet im Schnitt unter 5%.


Quelle: tradingeconomics.com
Im Vergleich dazu liegt die Arbeitslosenrate der Euro-Zone noch immer über 9%, siehe:
Quelle: tradingeconomics.com/euro-area/unemployment-rate

Auch die Demographien (Alterspyramiden) der Vereinigten Staaten, Kanada und Mexiko sehen weitaus gesünder aus, als die der meisten europäischer Staaten. Die Rentensysteme der USA, Kanada und Mexiko stehen auf sehr soliden Beinen und sind sehr nachhaltig gestaltet, nicht nur für Kinder, sondern auch bereits für Enkelkinder.
Quelle: www.indexmundi.com
Auch normalisieren sich derzeit die Leitzinsen auch in den Vereinigten Staaten von Amerika bereits wieder.
Quelle: www.leitzinsen.info

Also stelle ich provokant folgende Frage;
Was läuft jenseits des Atlantiks besser als in Europa (ohne Lichtgestalt wie Merkel und trotz Trump)?